
Dashboard & Monitoring
Transform your production data into actionable information with powerful, real-time dashboards. Discover patterns, optimize processes and make data-driven decisions that increase your productivity and quality
Production Dashboard
OEE
0%
Quality
0%
Batches
0
Trends (24h)
Machine Efficiency (%)
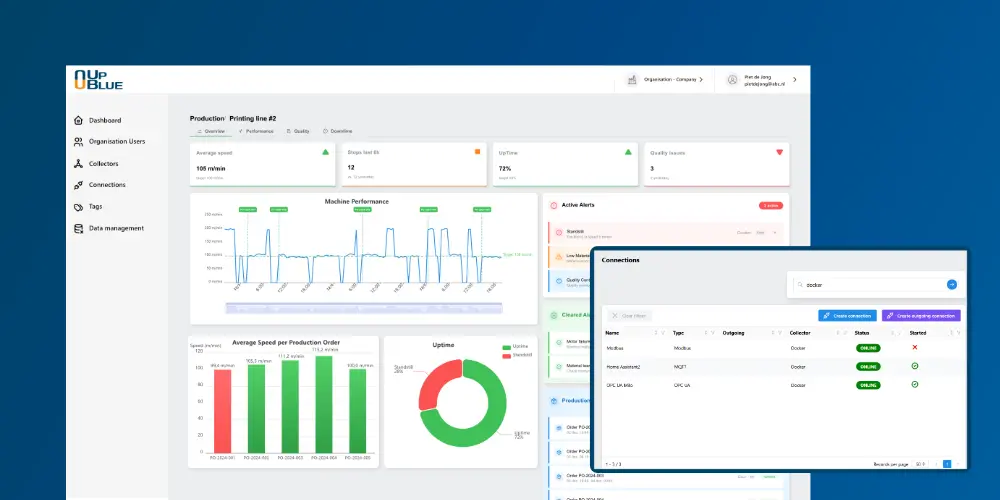
Real-time Production Dashboards
Get real-time insight into all your industrial processes with our dashboard solution. All (time-based) data is collected and presented in clear, interactive dashboards.
Increased OEE Scores
Average 15-25% improvement in Overall Equipment Effectiveness through real-time insightsPreventive Actions
Prevent unplanned downtime through early detection of deviations and trendsData-driven Decisions
Make decisions based on facts instead of feelings or assumptions
Production Dashboard
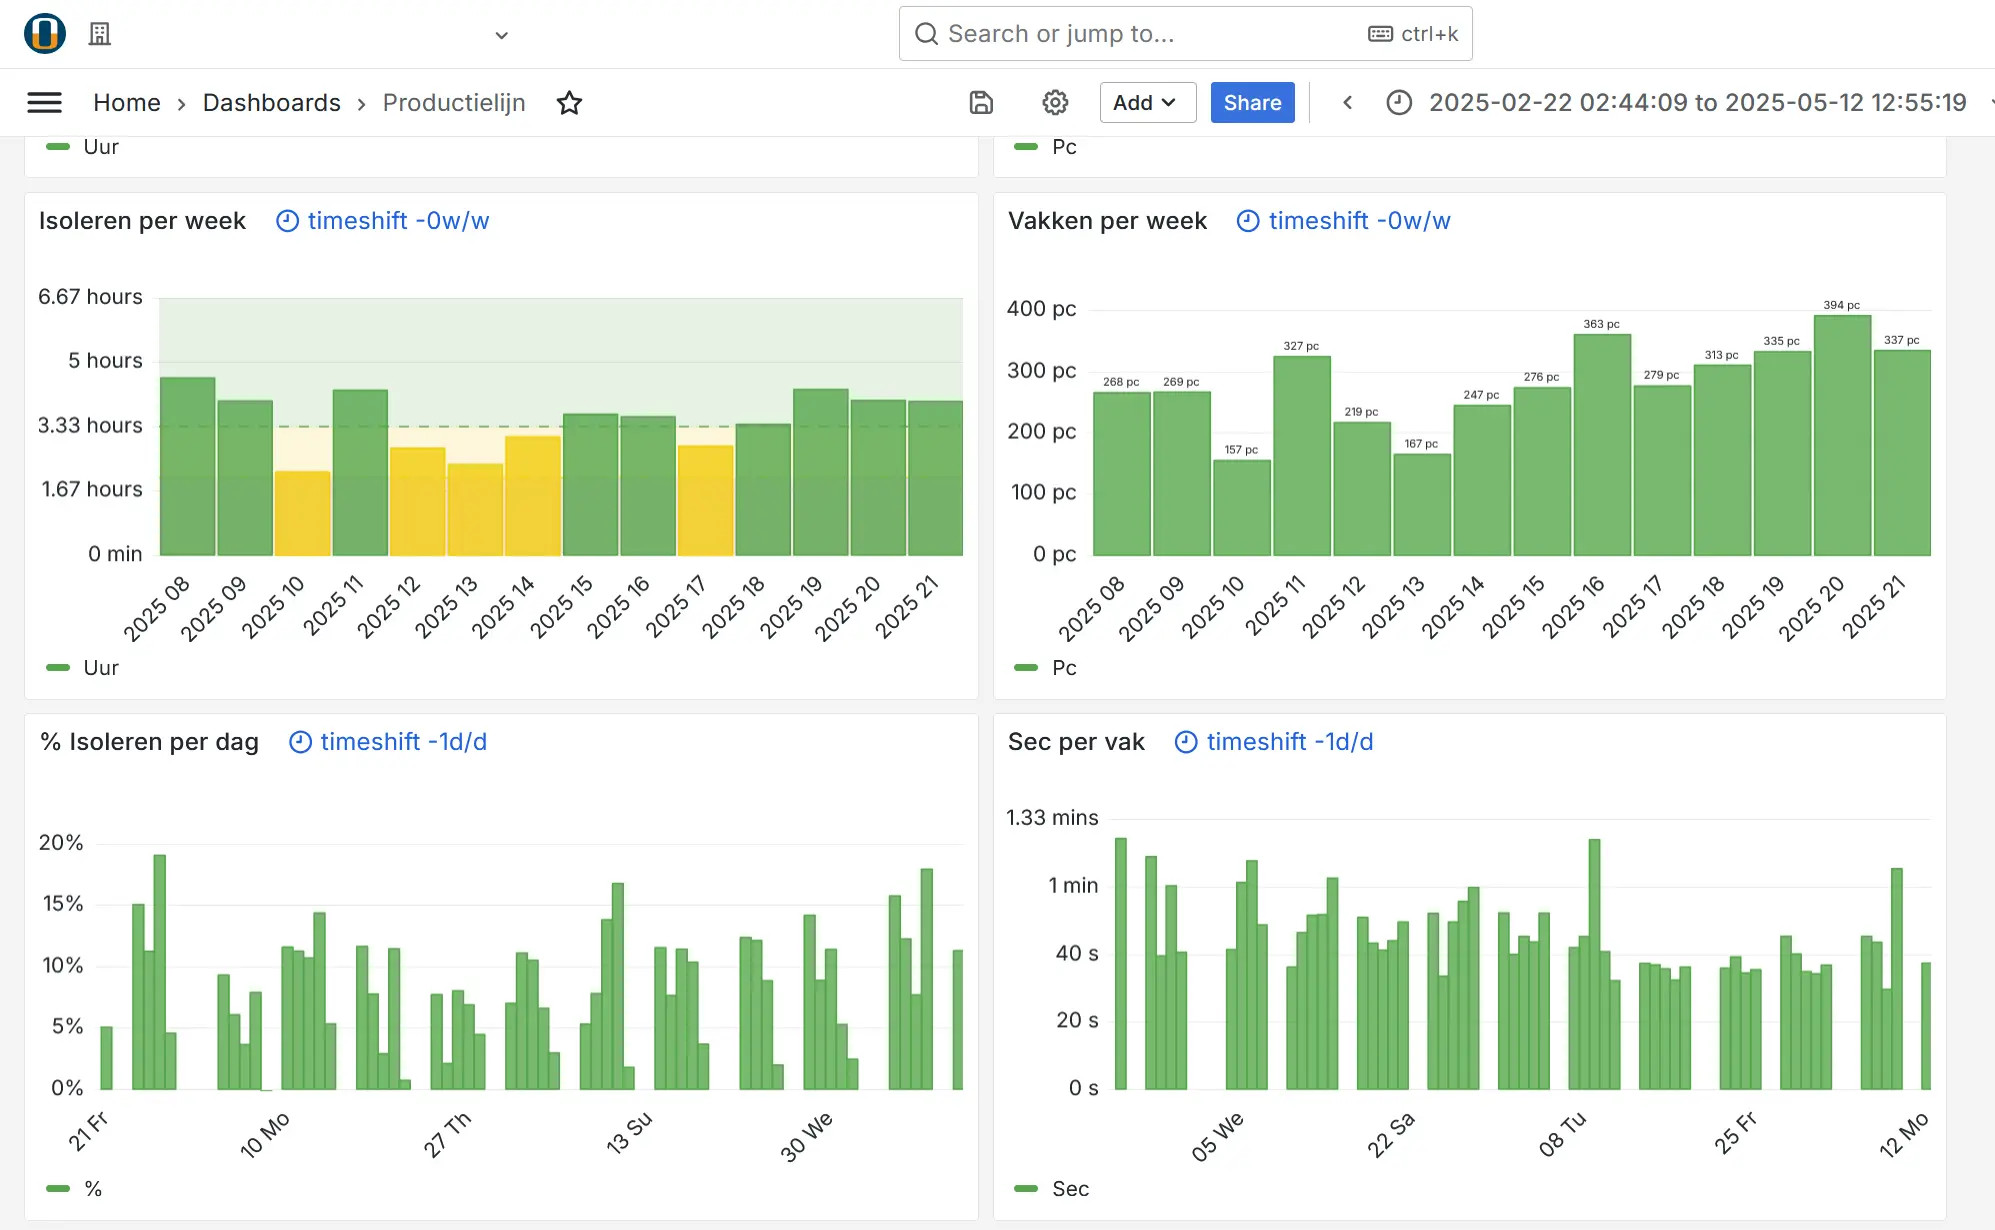
Analytics & Visualizations
Production Dashboard
Avg. Efficiency
87.5%
+2.3% vs last period
Total Batches
5
+1 vs last period
Quality Score
92.1%
+1.8% vs last period
Production Time
24.3h
-0.7h vs last period
Batch Performance Comparison
Performance Trends (Last 7 Days)
Fully Customizable Dashboards
Sensor-based Alert System
Real-time monitoring of all industrial sensors with intelligent alerts. Get instant notifications when sensor values deviate from normal ranges for proactive maintenance and optimal machine performance.
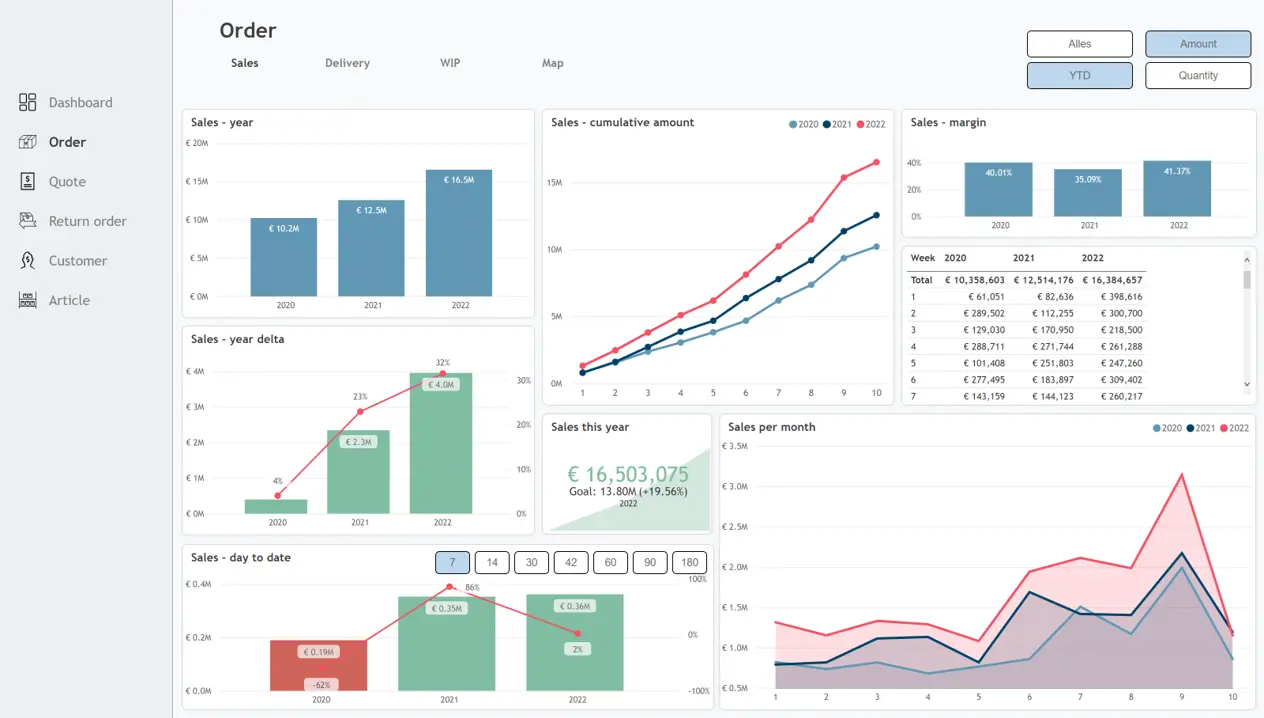
Power BI Integration
Integrate both your production and your ERP and sales data in Power BI dashboards for a complete overview of your factory. Use the power of Power BI for company-wide data analysis.
Our Power BI connector makes it possible to use your industrial data directly in Power BI dashboards for extensive analysis and reporting.
Ready-to-use Data Connection
Direct real-time data from UpBlue to Power BI with our Power BI connector
Power BI
Benefits of UpBlue Dashboarding
Discover how UpBlue dashboarding transforms your industrial processes with real-time insights, intelligent monitoring and fully customizable interfaces for optimal performance.
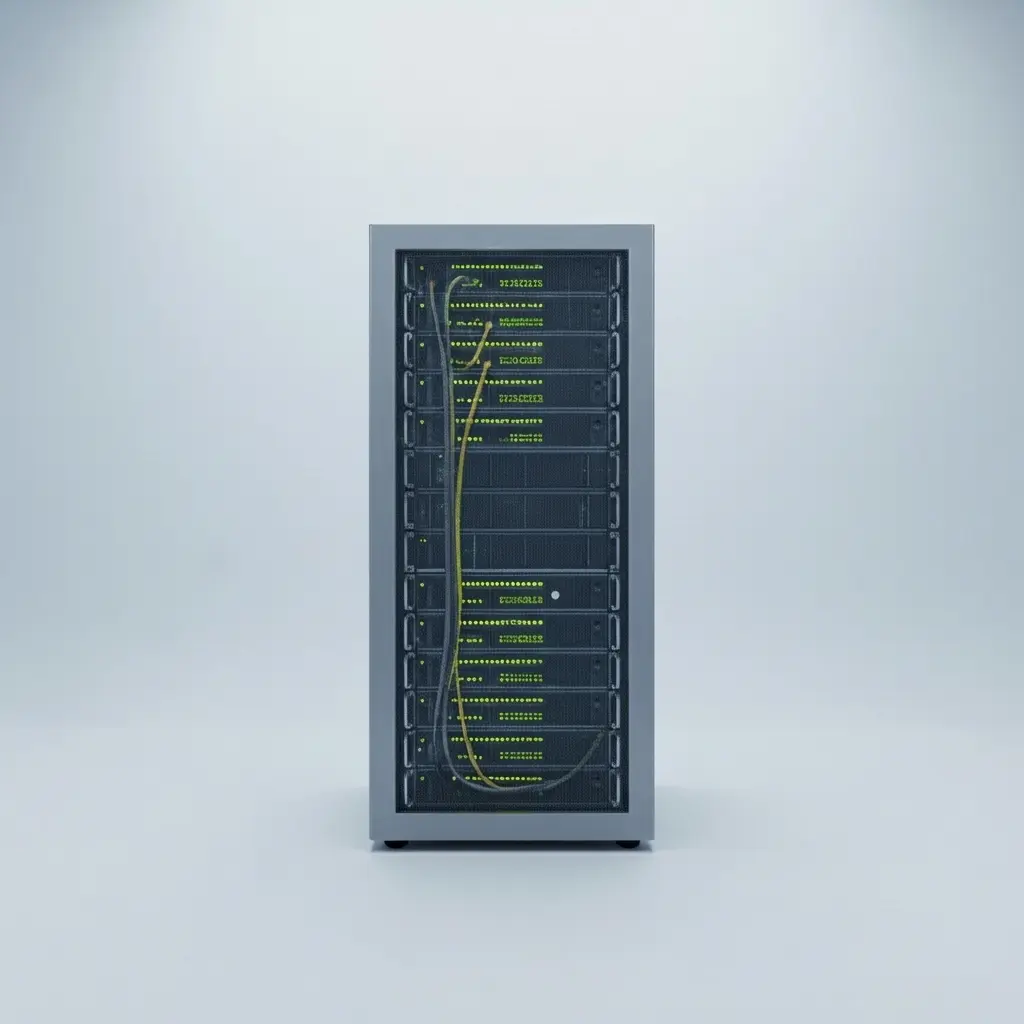
Historian Database
The Foundation for Dashboards
Store all your data securely with our Historian database. Analyze trends over long periods and make data-driven decisions based on historical patterns.
Long-term Storage
Years of historical data available for analysisTime-Series Optimization
Specialized database engine for lightning-fast queries over historical dataCloud Backup
Automatic backup for disaster recovery and business continuity
Other Functions
Our self-service Industry 4.0 software enables companies to modernize outdated IT systems, allowing teams to independently and efficiently handle increasing product and process complexity.

© 2026 UpBlue B.V. All rights reserved.