
Power BI Integration for Industrial Data
Integrate your production, ERP and sales data in Power BI dashboards for data-driven decision-making and operational efficiency.
Power BI Dashboard
Revenue
Orders
Efficiency
Production
Monthly Sales (€K)
Production Output (Units/Hour)
Product Categories
Motors 45%
Pumps 30%
Valves 25%
Motors 45%
Pumps 30%
Valves 25%
OEE Score
Availability: 97%
Performance: 98%
Quality: 99%
↗ +2.1% vs target
Availability: 97%
Performance: 98%
Quality: 99%
↗ +2.1% vs target
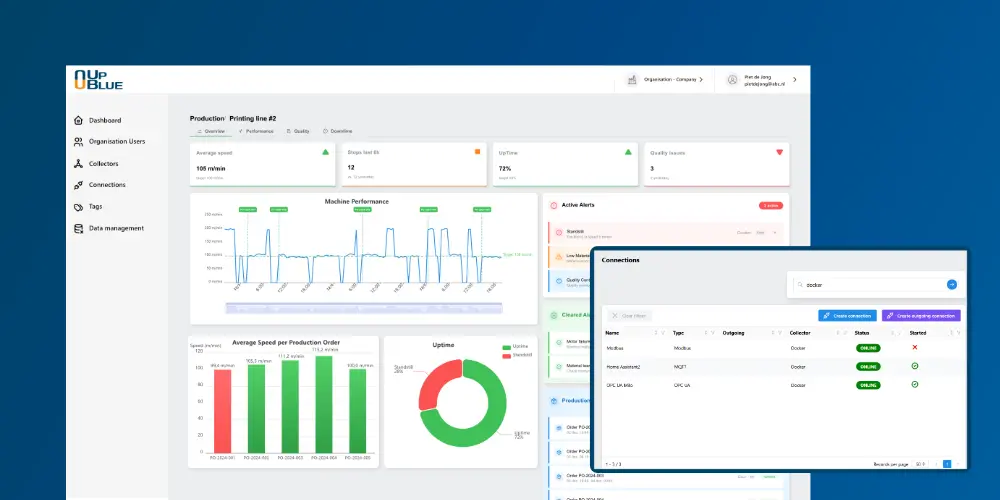
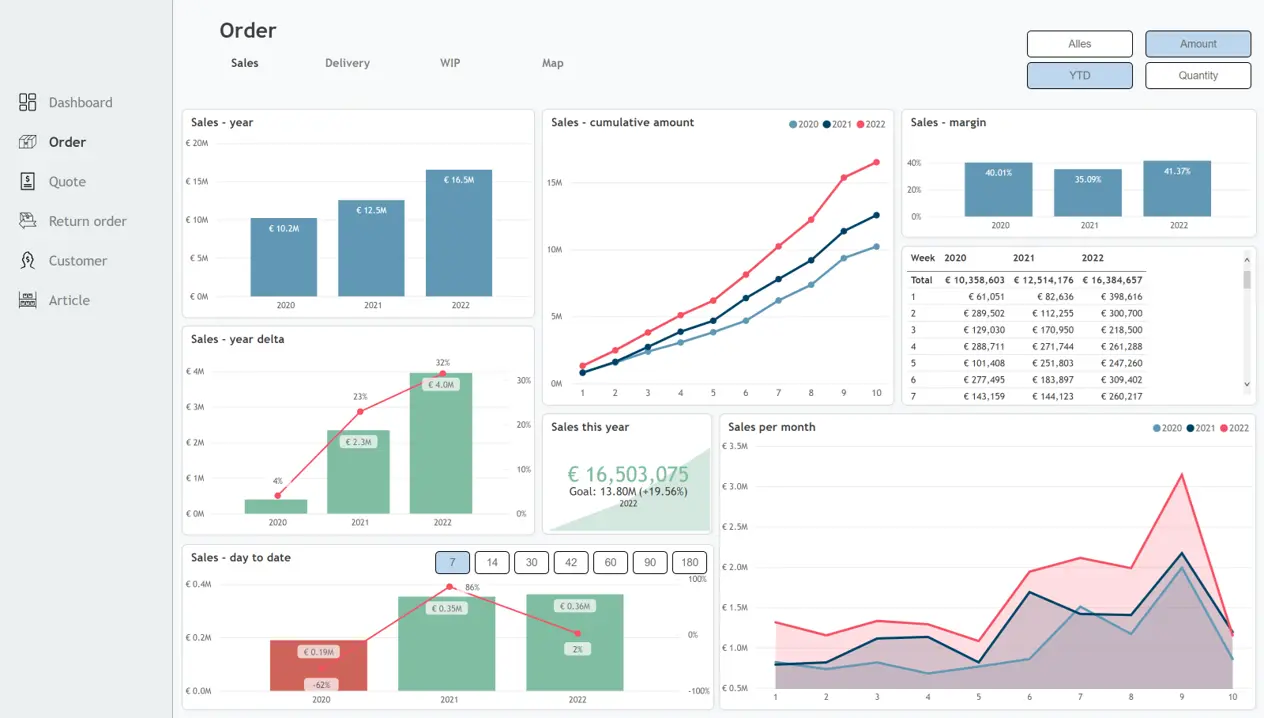
ERP and Sales/CRM coupling
Integrate ERP and CRM data directly with production data for a complete overview of your business processes. This coupling makes it possible to measure and compare orders and batches on uptime, speed, duration and efficiency, allowing you to make data-driven decisions that optimize your entire business operation.
Compare orders and batches
Measure and compare orders and batches on uptime, speed, duration and efficiencyERP and CRM data integration
Integrate ERP and CRM data directly with production data

Real-time Performance Analysis
Get immediate insight into order status, progress and bottlenecks through real-time performance analysis. Link sales forecasts and actual performance for accurate analyses that help you respond proactively to production challenges and opportunities.
Direct insight into order status
Monitor order status, progress and bottlenecks in real-timeForecasts vs. reality
Link sales forecasts and actual performance for accurate analysesProactive bottleneck management
Identify and resolve bottlenecks before they affect production

Dashboard functionalities
Production Dashboard
Avg. Efficiency
87.5%
+2.3% vs last period
Total Batches
5
+1 vs last period
Quality Score
92.1%
+1.8% vs last period
Production Time
24.3h
-0.7h vs last period
Batch Performance Comparison
Performance Trends (Last 7 Days)
Production data per Order & Batch in Power BI
Automatically link production data to specific orders and batches during production. Analyze performance per order in Power BI dashboards for data-driven production optimization.
Production data per Order
View which production parameters deviate from the pre-calculation per order and identify improvement pointsBatch Performance Comparison
Compare production efficiency between different batches and identify best practicesParameter Analysis per Production order
Analyze extreme values of production parameters such as temperature, pressure and speed per order and batchProduction Consistency Monitoring
Measure the stability of your production process by analyzing variations in production data per order
Batch Performance
B-2024-003
Quality
99.2%
Efficiency
96.8%
Yield
98.1%
B-2024-005
Quality
96.8%
Efficiency
92.1%
Yield
94.7%
B-2024-002
Quality
97.1%
Efficiency
89.5%
Yield
95.2%
B-2024-001
Quality
98.5%
Efficiency
94.2%
Yield
96.8%

Power BI in your factory?
Other Solutions
Our self-service Industry 4.0 software enables companies to modernize outdated IT systems, allowing teams to independently and efficiently handle increasing product and process complexity.

© 2026 UpBlue B.V. All rights reserved.